
Improved Charts
June 28, 2017
The Vantage and Pro models now have an enhanced version of the built-in charting tool. This new version allows automatic or manual scaling to better display chart detail.
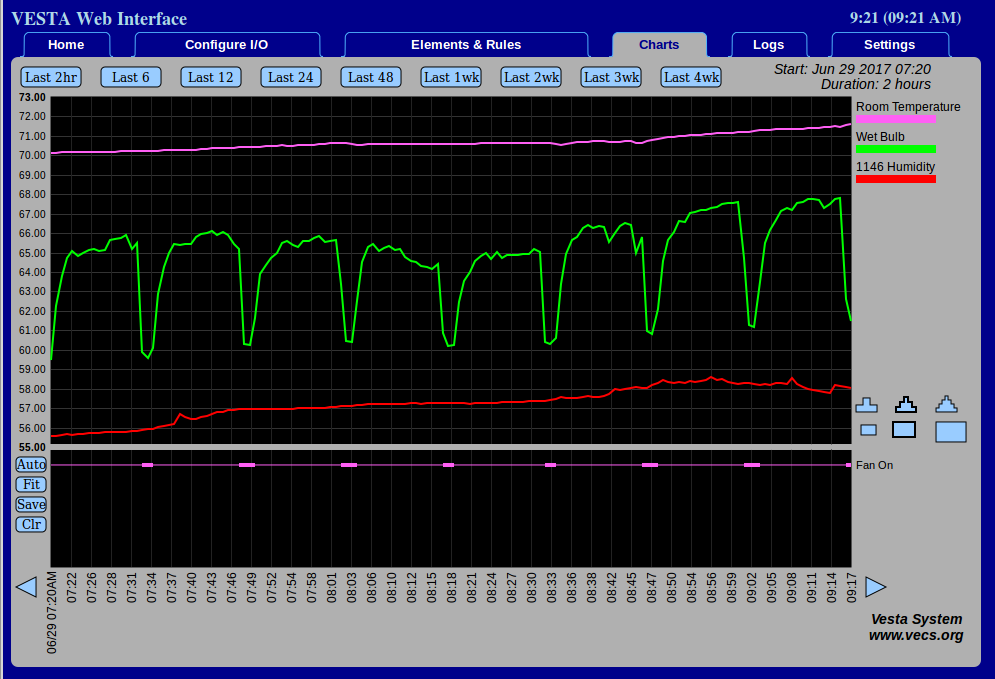
Once you have selected the data you wish to view, simply click the 'Auto' button along the lefthand side of the Charts window to automatically scale the display to fit the selected data.
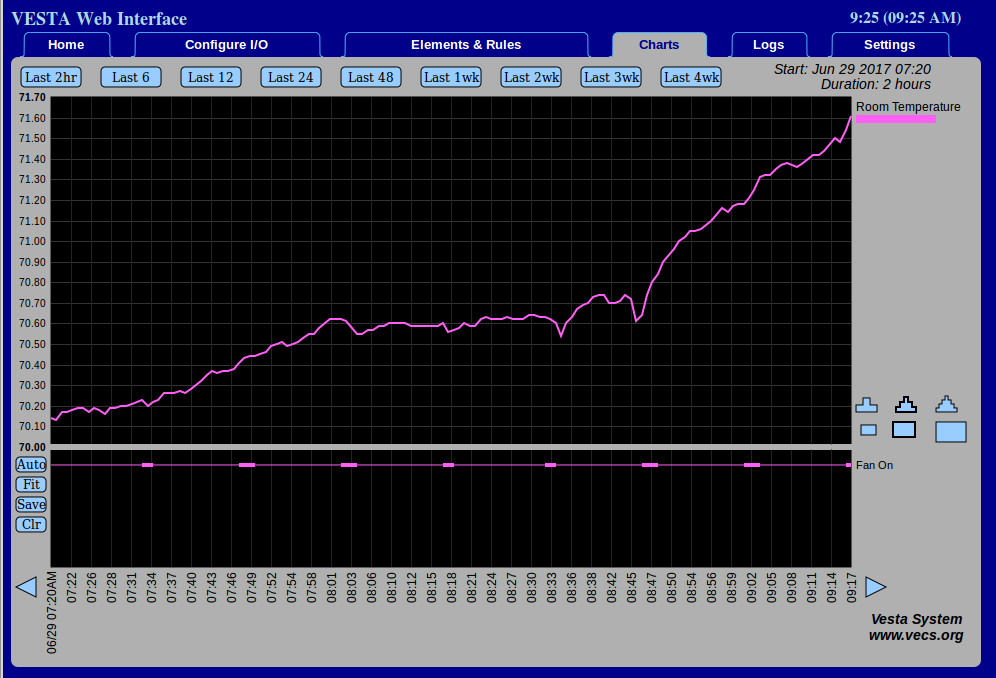
This feature allows you to see a level of detail appropriate for the data by zooming in to analyze smaller changes in readings, or zooming out to show more varied data readings in relation to each other. Now you can see more detailed measurements and see subtle trends and patterns in low-variation data.